Perceptron to MNN
In my previous post Why deep learning? I gave reasons why one would choose deep learning algorithms. An explanation of what a deep learning algorithm solves that a machine learning algorithm does not. In this post, I’d like to explore deep learning algorithms and how their input looks like.
Learning about linear models is essential to understanding neural networks and how do we visualize this type of model?
In the linear model, the data points are separated by hyperplanes which is given by the formula:
where m is the slope of the hyperplane and c is the intercept, or the position where the hyperplane meets the axis.
As an example, let’s look at the following
let X = [1, 0, 1], W = [1, 1, 1] and b = 1
A linear model can be visualized as follows to predict the Y value for the above input
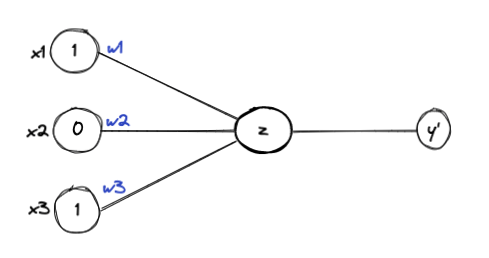
Recalling the equation for the hyperplane (a line may be with a slope), the linear model can be given as follows
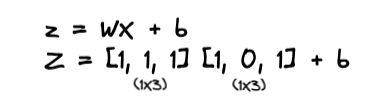
The above cannot be multiplied since they are incompatible. You can handle this issue by performing a transpose on either the input matrix or the weight matrix. Due to the convention followed in representing the input as a columnar matrix, I took the transpose of the input matrix for this post.

The above system of equation can be abstracted as follows In the linear model, the data points are separated by hyperplanes, which is given by the formula:
where m is the slope of the hyperplane and c is the intercept, or the position where the hyperplane meets the axis.
Weights and bias are randomly initialized. The idea is that when we predict a Y value, denoted as Y’. We can then compare Y’ with Y and then adjust the weights such that Y’ is close to Y. We repeat this process till we find optimal weight value for predicting Y.
The idea works well if the data is linearly separable and a hyperplane can clearly separate the data. This algorithm won’t converge if the data is non-linearly separable and we can’t find optimal weights.
We are attempting to figure out the optimal weights here. In other words, we are trying to determine the slope of the hyperplane that can separate the data points. This algorithm is called a Perceptron algorithm, also known as a neuron.
How can we find a hyperplane for data that isn’t linearly separable?
The idea is to look at the data from different angles and try to find a plane that can separate these data points. Multi-layer perceptrons allow us to achieve this by feeding data through multiple neurons.
The following diagram illustrates a multilayer perceptron also known as a neural network.
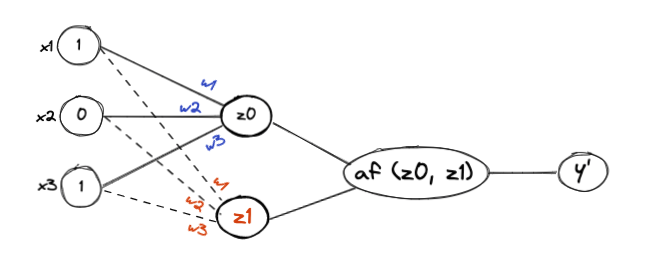
There is something important to note here, which is a neural network with a single hidden node is a linear model. We introduce non-linearity by adding multiple layers and multiple hidden nodes (neurons), this allows us to view the input data in a different plane. Since linear operations are easier in higher dimensions, we want to view the input data in higher dimensions.
The above neural network can be represented by the following system of equations:
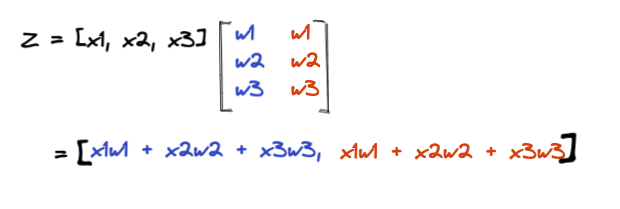
Activation function scales output into the [0, 1] range. Depending on the problem statement we predict the value Y’.
Let’s move on to the next section of the blog, which is how we can feed the data into the neural network (personally, this is the most interesting part).
In order to learn how to input data of n rows and m columns into neural networks, let’s consider the following example of house price prediction.
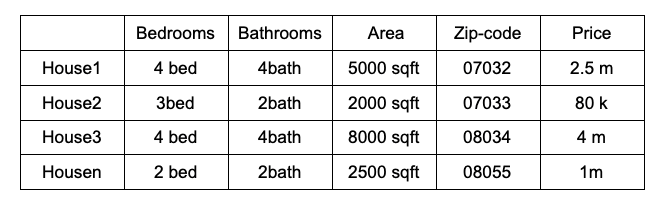
The neural network for the above example can be designed as follows
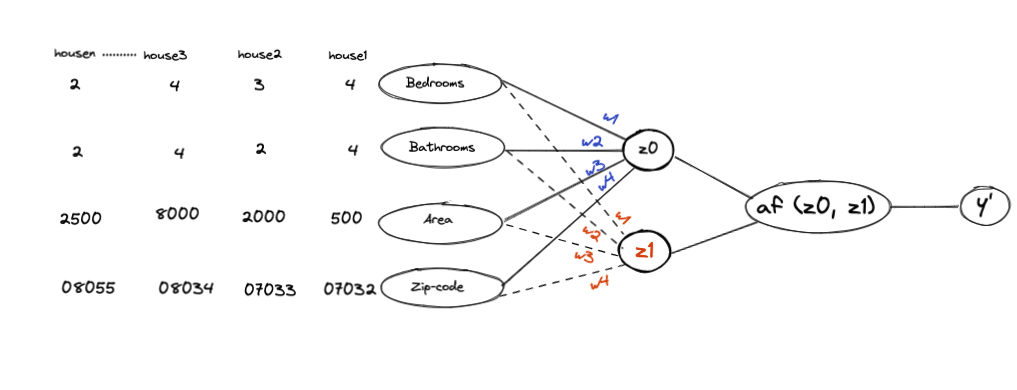
This is a system of equations for predicting the price of a house given its details, like the number of bedrooms, bathrooms, location, etc.
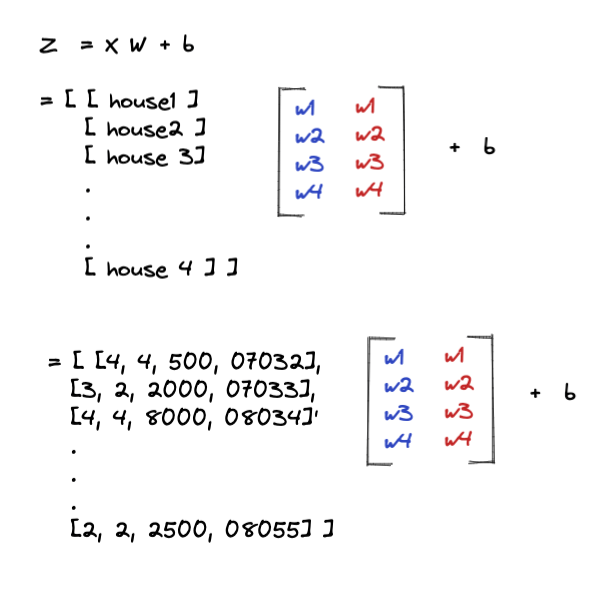
In this example, we have n houses and 4 features, so the input matrix will be nX4. Due to the two hidden nodes in this example, we would need to initialize 2 new weights if we were to add more features. As the dataset grows, the input matrix will have more rows. Adding one more node to the existing network would add a column to the weight matrix.
Once we compute the value of Z we send it to an activation function which will give a value between [0, 1]
Please note that the input rows, which represent the details of a house, are not dependent on each other. Each sample is independent and identically distributed random variables i.e. House1’s price is independent of House2’s price. This is the assumption made to build the above neural network.
What about variables that aren’t independent and identically distributed, such as textual data, time series data, or even details of stock prices? How are those variables fed into our neural network?
I will explore these questions in my future posts.